
Step 1: Create the Required Column Headers
Add the following column headers to the first row of the spreadsheet:
- Facility
- Metric Category
- Metric Name
- Expected Input Type
- UOM
- Reporting Granularity
- Chart Type
- What to Chart
- Chart Values Should Be
- Calculated Metric
If any metric will use Meter Reading as its Expected Input Type, add a column with the header Meter Names immediately after Metric Name.
The column order would then be:
- Facility
- Metric Category
- Metric Name
- Meter Names
- Expected Input Type
- UOM
- Reporting Granularity
- Chart Type
- What to Chart
- Chart Values Should Be
- Calculated Metric
NOTE: Do not rename the columns.
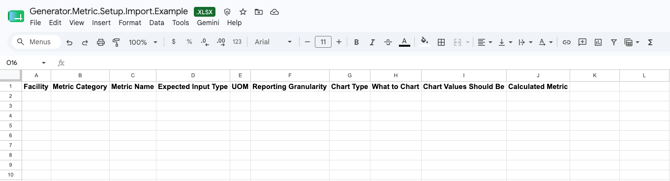
Note: Download a Template Source Environmental Metric spreadsheet here.
Step 2: Add One Metric per Row
Each row should represent one Source Environmental Metric.
If the same metric applies to multiple facilities, enter all applicable facilities in the Facility cell rather than creating a separate row for each facility.
Create separate rows when the metrics require different:
-
Names
-
Units of measure
-
Input types
-
Categories
-
Reporting schedules
-
Chart settings
Facility:
In the Facility column, enter the exact name of each facility where the metric should be available.
If the metric applies to multiple facilities:
- Enter all applicable facility names in the same cell.
- Separate each facility with a comma.
- Include one space after each comma.
Example:
Building 1, Building 2, Project 1
NOTE: Facility names must match the facility names configured in the EHS‑Dashboard. Do not use abbreviations, semicolons, or line breaks.
Metric Category
In the Metric Category column, use an existing category name exactly.
NOTE: Please refer to this Managing Metric Categories Knowledge Base document for more information on where to find and manage Metric Categories.
Illustrative Metric Category examples include:
- Resource Usage
- Equipment Run Time
If the required category does not exist, create it in the EHS‑Dashboard before completing the import sheet.
Metric Name
In the Metric Name column, enter a clear and distinguishable name for the metric.
Illustrative examples include:
- EU25 Diesel Usage
- EU42 Run Time
- Monthly Natural Gas Usage
- 6381092 Ethanol Manufacturing
NOTE: For equipment-specific metrics, it is helpful to include the applicable equipment or emission-unit identifier in the name.
Expected Input Type
In the Expected Input Type column, select how the metric will be configured:
QuantityMeter Reading
Select Quantity when users will enter the amount used or generated during the reporting period.
Select Meter Reading when users will enter readings from a cumulative meter, such as equipment runtime hours.
If Meter Reading is selected:
- Add the
Meter Namescolumn immediately afterMetric Name. - Enter the name of the meter associated with the metric.
NOTE: For convenience, the Metric Name and Meter Name are recommended to be identical.
Example:
- Metric Name:
EU42 Run Time - Meter Name:
EU42 Run Time
If Quantity is selected, a Meter Name is not required.
Unit of Measure
In the UOM column, enter the unit in which users will report the metric.
Illustrative UOM examples include:
- gal
- L
- lb
- therm
- hr
- pieces
Reporting Granularity
In the Reporting Granularity column, select how frequently the metric will be reported.
Options include:
-
Quarterly
-
Monthly
-
Weekly
-
Daily
-
Annually
Select the reporting granularity that corresponds to how frequently users will enter, import, or review the metric data.
Avoid spaces before or after the selected value.
Chart Type
In the Chart Type column, select how the metric should be displayed, or select:
None
Available chart types include:
-
Line
-
Simple Bar
-
Stacked Bar
NOTE: There are other opportunities within the system to Create and Configure Widgets in Workspaces if additional charting is desired.
If Chart Type is None, the following fields are not required and may be left blank:
-
What to Chart
-
Chart Values Should Be
If Chart Type is anything other than None, complete both fields.
Complete the Chart Settings, A Needed
If Chart Type is anything other than None, complete the following fields:
- What to Chart
- Chart Values Should Be
What to Chart identifies the metric value that should be displayed.
Options may include:
UsageCost
Chart Values Should Be identifies how multiple values should be handled.
Options may include:
SumsAverages
Illustrative chart configuration:
- Chart Type:
Line - What to Chart:
Usage - Chart Values Should Be:
Sums
If Chart Type is None, leave What to Chart and Chart Values Should Be blank.
Identify Whether the Metric Is Calculated
In the Calculated Metric column, enter: FALSE
This identifies the metric as a Source Environmental Metric where the value will be entered or imported directly rather than calculated from other Environmental Metrics.
A Source Environmental Metric may receive data through:
- Manual data entry
- A meter reading
- A spreadsheet import
- A utility integration
- Another approved data integration
Calculated Environmental Metrics should be configured separately after the Source Environmental Metrics have been created and assigned Environmental Metric IDs.
Step 3: Review the Import Sheet
Before submitting the spreadsheet for import:
- Confirm that the column headers are correct and in the required order.
- Confirm that each row represents one Source Environmental Metric.
- Confirm that each Facility name matches the name configured in the EHS‑Dashboard.
- Confirm that multiple facilities are separated by a comma and one space.
- Confirm that each Metric Category uses an existing category name exactly.
- Confirm that each metric has a clear and distinguishable Metric Name.
- Confirm that Expected Input Type is either
QuantityorMeter Reading. - Confirm that Meter Names are included for all meter-reading metrics.
- Confirm that each UOM is spelled and capitalized correctly.
- Confirm that the Reporting Granularity is selected.
- Confirm that Chart Type is selected or set to
None. - Confirm that What to Chart and Chart Values Should Be are completed when Chart Type is anything other than
None. - Confirm that Calculated Metric is set to
FALSE. - Remove blank rows within the metric data.
- Remove notes, totals, section headings, or formulas from the import table.
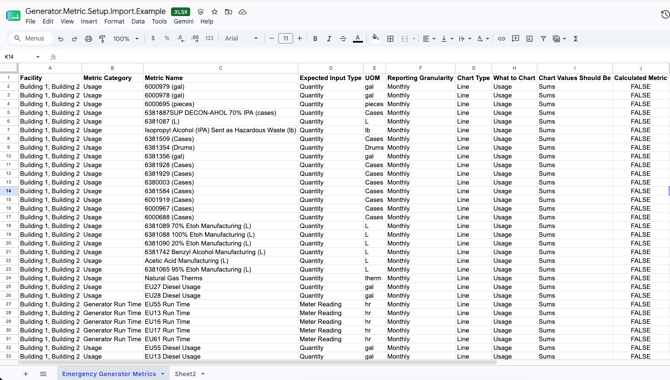
Outcome
Once the Source Environmental Metric Import Sheet is properly configured, the metrics are ready to be imported into the EHS‑Dashboard with their facility associations, input types, units of measure, reporting schedules, and chart settings.